Analytics Dashboard
KPI strip — total checks, passed, blocked, pass rate at a glance:

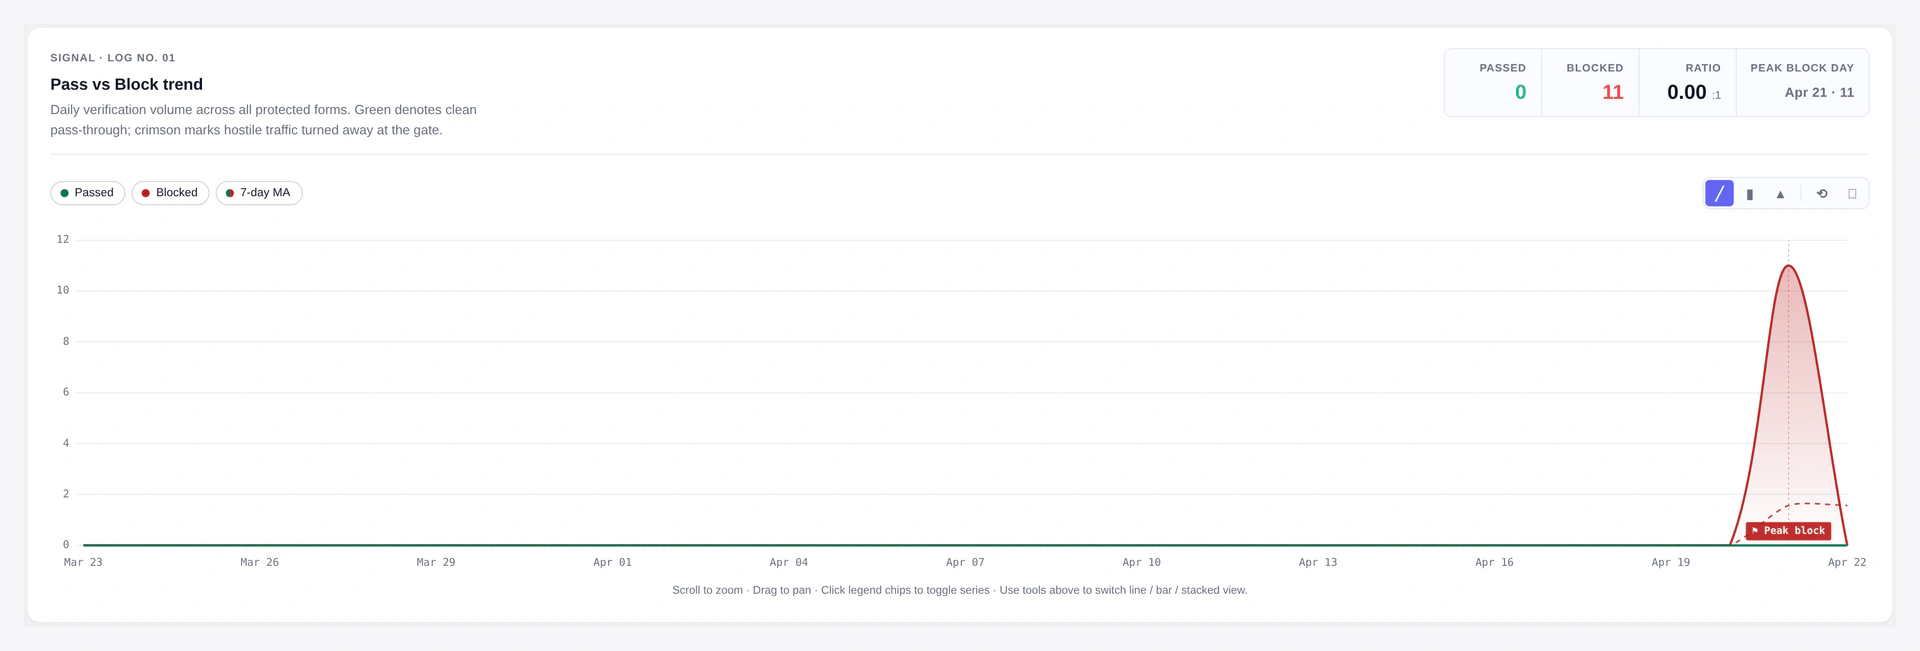
Pass vs Block trend — daily volume, 7-day moving average, peak block day:
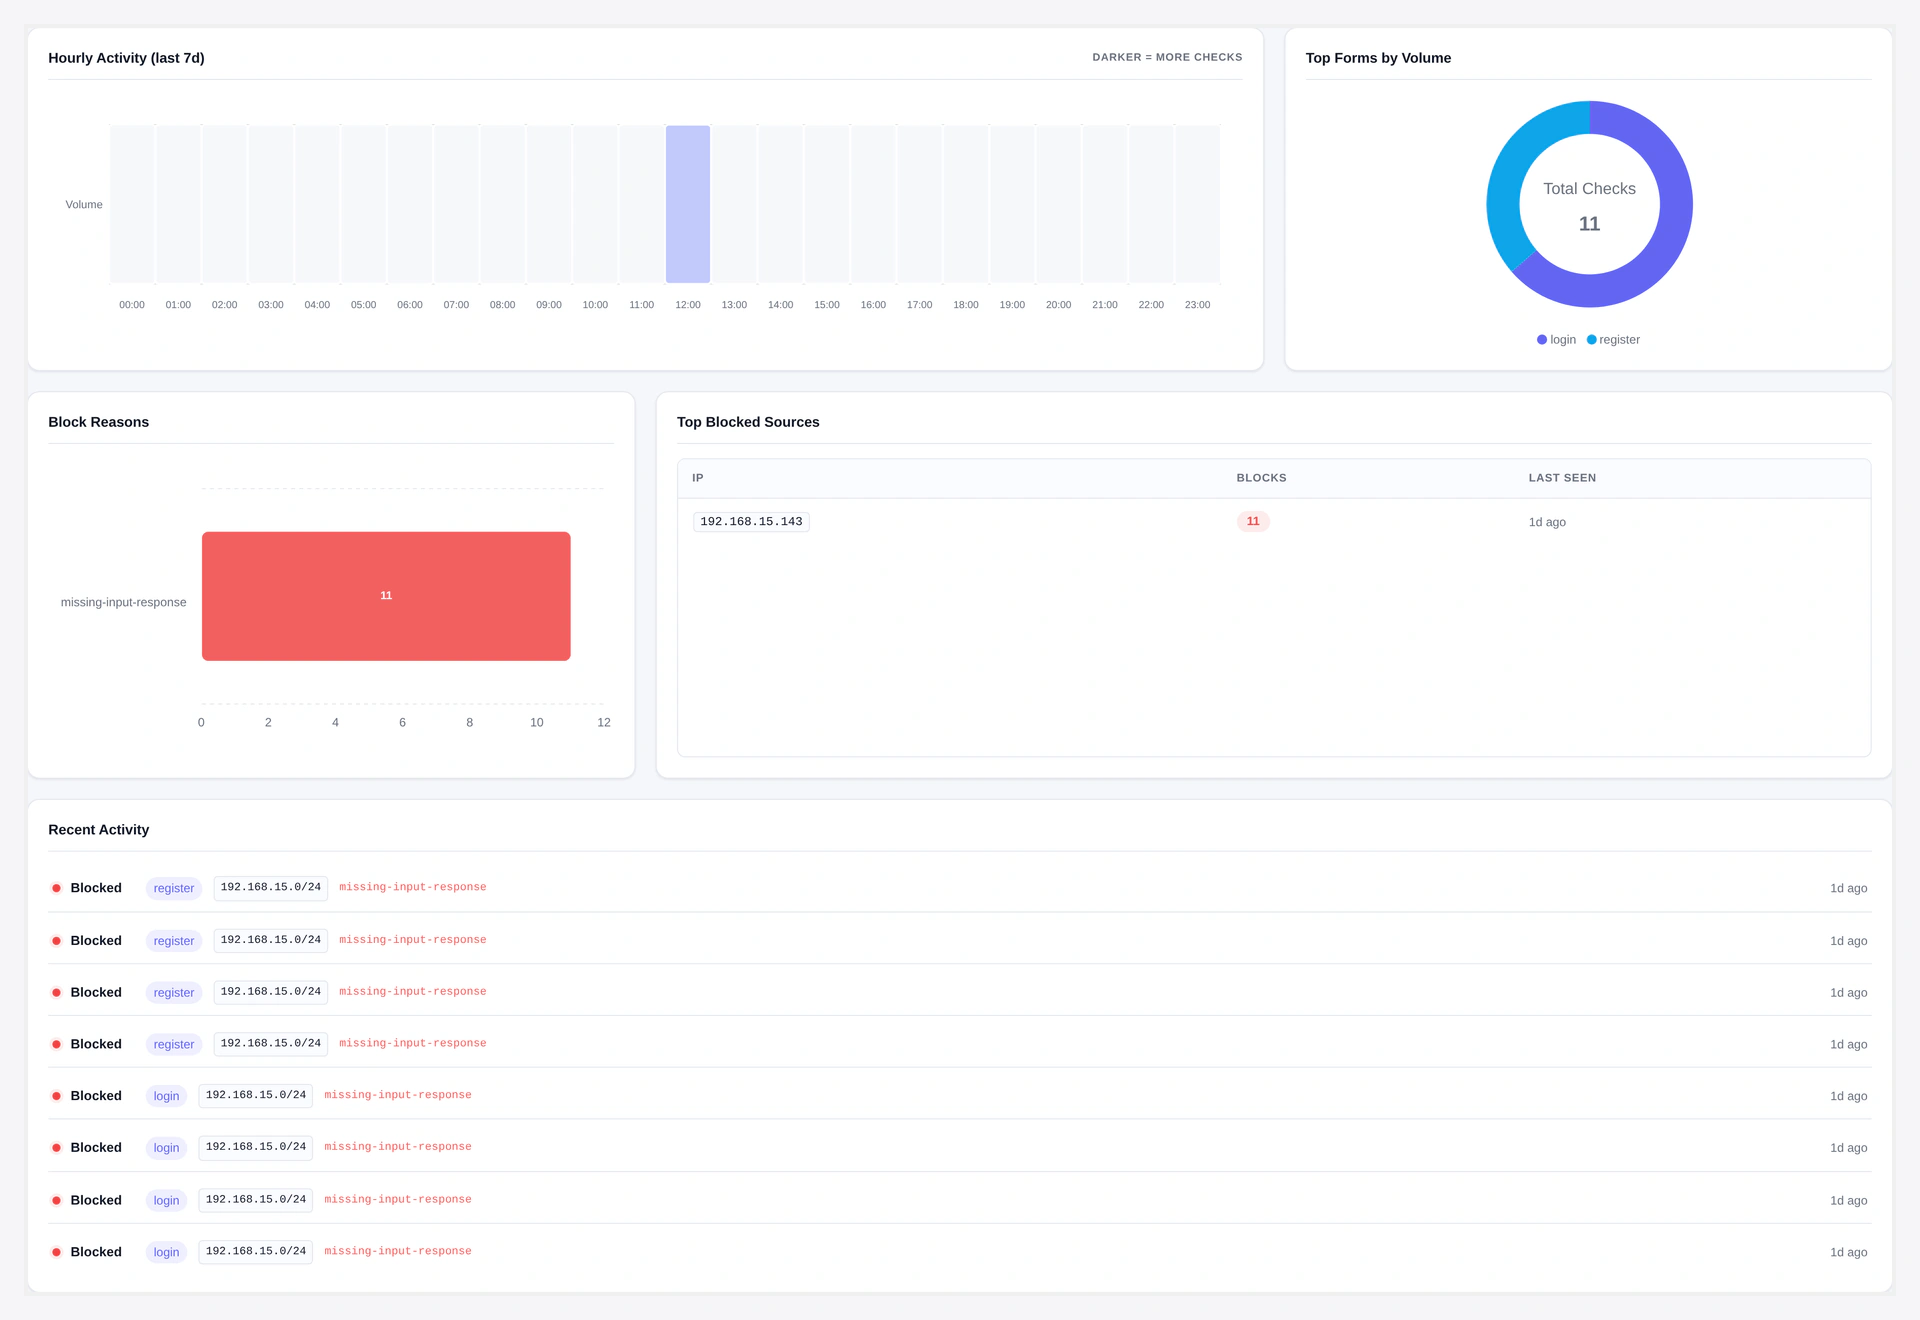
Insights panel — top forms, error breakdown, top blocked IPs:
See exactly how much bot traffic Turnstile is blocking, which forms are hit hardest, and which IPs to add to your blacklist.
URL: wp-admin/admin.php?page=wkcft-analytics
Access: Under WooCommerce → Webkul Addons → Analytics. Capability required: manage_woocommerce.
Header KPIs
Four cards across the top:
| Card | What It Shows |
|---|---|
| Total checks | Every CAPTCHA validation in the selected range (passes + fails) |
| Passed | Successful validations (green) |
| Failed | Failed validations — your blocked bots (red) |
| Pass rate | Percentage — realistic real-user sites see 60-95% pass |
Date Range
Top-right selector:
| Range | Use When |
|---|---|
| Last 7 days | Daily pulse check |
| Last 30 days | Typical monthly review |
| Last 90 days | Trend analysis |
| All time | Long-term view since install |
Trend Chart
Line chart showing Pass vs Block over the selected period.
- X-axis: Time (daily bucket by default, hourly if range ≤ 2 days)
- Y-axis: Count
- Green line: Passes
- Red line: Blocks (failures)
- Zoom: Mouse wheel to zoom in, drag to pan
- Reset zoom: Double-click
Good stuff to spot:
- Sudden block spike = attack in progress
- Slow block increase = bot traffic trending up
- Near-zero after a fix = healthy
Hourly Heatmap
Shows the last 7 days broken into 168 hourly buckets (24×7 grid).
- Darker cell = more CAPTCHA attempts
- Use to see "Tuesday 3am" attack patterns
- Hover any cell for exact count
Top Forms
Donut chart ranking forms by total volume.
- Shows top 5 forms
- Click a slice to filter all other charts to that form
- Use to identify which form is being targeted most
Top Blocked IPs
List of IPs with the most failed validations.
| Column | Meaning |
|---|---|
| IP | The raw IP (last 30 days retention) |
| Blocks | Total failed validations |
| Last seen | Timestamp of the most recent block |
| Action | Add to IP blacklist button — one click adds to conditions |
Great workflow: see a suspicious IP, one-click blacklist it.
Error Breakdown
Pie chart of Cloudflare error codes:
| Error | What It Means |
|---|---|
missing-input-response | Bot did not even render the widget |
invalid-input-response | Token invalid — expired or manipulated |
timeout-or-duplicate | Same token used twice OR token expired (cached pages) |
rate-limited | IP hit the plugin's rate-limit threshold |
prohibited-replay | Token replay attempt |
invalid-input-secret | Your Secret Key is wrong (fix on API Settings) |
Healthy sites see mostly missing-input-response — that means real bots are being stopped silently.
Recent Activity
Table of the last 100 log entries:
| Column | Meaning |
|---|---|
| Timestamp | When the check happened |
| Form | Which form was protected |
| Result | Passed / Blocked |
| Error | Cloudflare error code (only on fails) |
| IP | Client IP |
| UA | User-Agent (hashed — just a fingerprint, not the actual string) |
CSV Export
Click Export CSV to download the raw data for your date range.
Columns:
- Date
- Form
- Count (total checks)
- Pass rate
Format: standard CSV, UTF-8, RFC 4180. Opens in Excel, Google Sheets, any analytics tool.
Caching
Analytics queries are cached for 5 minutes to keep the page fast.
- Cache group:
wkcft_stats - TTL: 300 seconds
- Clears on:
- New log entry (write-through invalidation)
- Admin clicks "Refresh now" button
Data Source
Everything comes from the wp_wkcft_log table:
CREATE TABLE wp_wkcft_log (
  id BIGINT(20) UNSIGNED AUTO_INCREMENT PRIMARY KEY,
  form VARCHAR(64) NOT NULL DEFAULT '',
  passed TINYINT(1) NOT NULL DEFAULT 0,
  error_code VARCHAR(64) NOT NULL DEFAULT '',
  ip VARCHAR(45) NOT NULL DEFAULT '',
  ua_hash CHAR(32) NOT NULL DEFAULT '',
  created_at DATETIME NOT NULL DEFAULT CURRENT_TIMESTAMP,
  KEY created_at (created_at),
  KEY form (form),
  KEY ip (ip)
);
- IPs are stored raw for the Top Blocked IPs feature (so you can one-click blacklist them)
- User-Agents are hashed (MD5) — no readable UA ever hits the database
Log Retention
- Daily WP-Cron job
wkcft_logger_purgedeletes rows older than 90 days - To change retention, filter:
add_filter('wkcft_log_retention_days', function() {
    return 30; // keep 30 days instead of 90
});
Disable Logging
If you run a very high-traffic site and do not want the logging overhead:
add_filter('wkcft_log_enabled', '__return_false');
Analytics page will show "No data available" but the plugin still protects your forms.
Performance Notes
- Log insert = ~1ms per validation
- Table is indexed on
created_at,form,ipfor fast aggregation - Even at 100K rows, the 30-day dashboard loads in under 500ms
REST API Access
Same data via REST:
GET /wp-json/wkcft/v1/stats?range=30
Response shape: REST API.
Troubleshooting
| Problem | Fix |
|---|---|
| "No data available" | No form submits yet — test a form, then refresh |
| Numbers do not match Cloudflare's own analytics | Expected — plugin counts server-validated tokens, Cloudflare counts widget renders |
| Page slow to load | Database table too big — lower retention to 30 days via filter |
| Top blocked IPs empty | No failed validations in range — either you have zero bots OR logging is disabled |
| Export CSV empty | Date range has no data |
Related Pages
- Email Digest — Same data, pushed to your inbox
- Webhooks — Alert on block-rate spikes
- Conditional Rules — Use top-blocked IPs to feed the blacklist