Dashboard
Data shows after first sync
Dashboard KPIs and charts populate after your first successful sync. If everything shows 0, go to Sync and run a manual sync first.
The Dashboard is the first page you see inside Webkul WC Addons → Power BI Connector. It gives you an at-a-glance view of connection status, recent sync activity, and key store KPIs — powered by the data that has been pushed to Power BI.
URL: /wp-admin/admin.php?page=wkpbic-dashboard
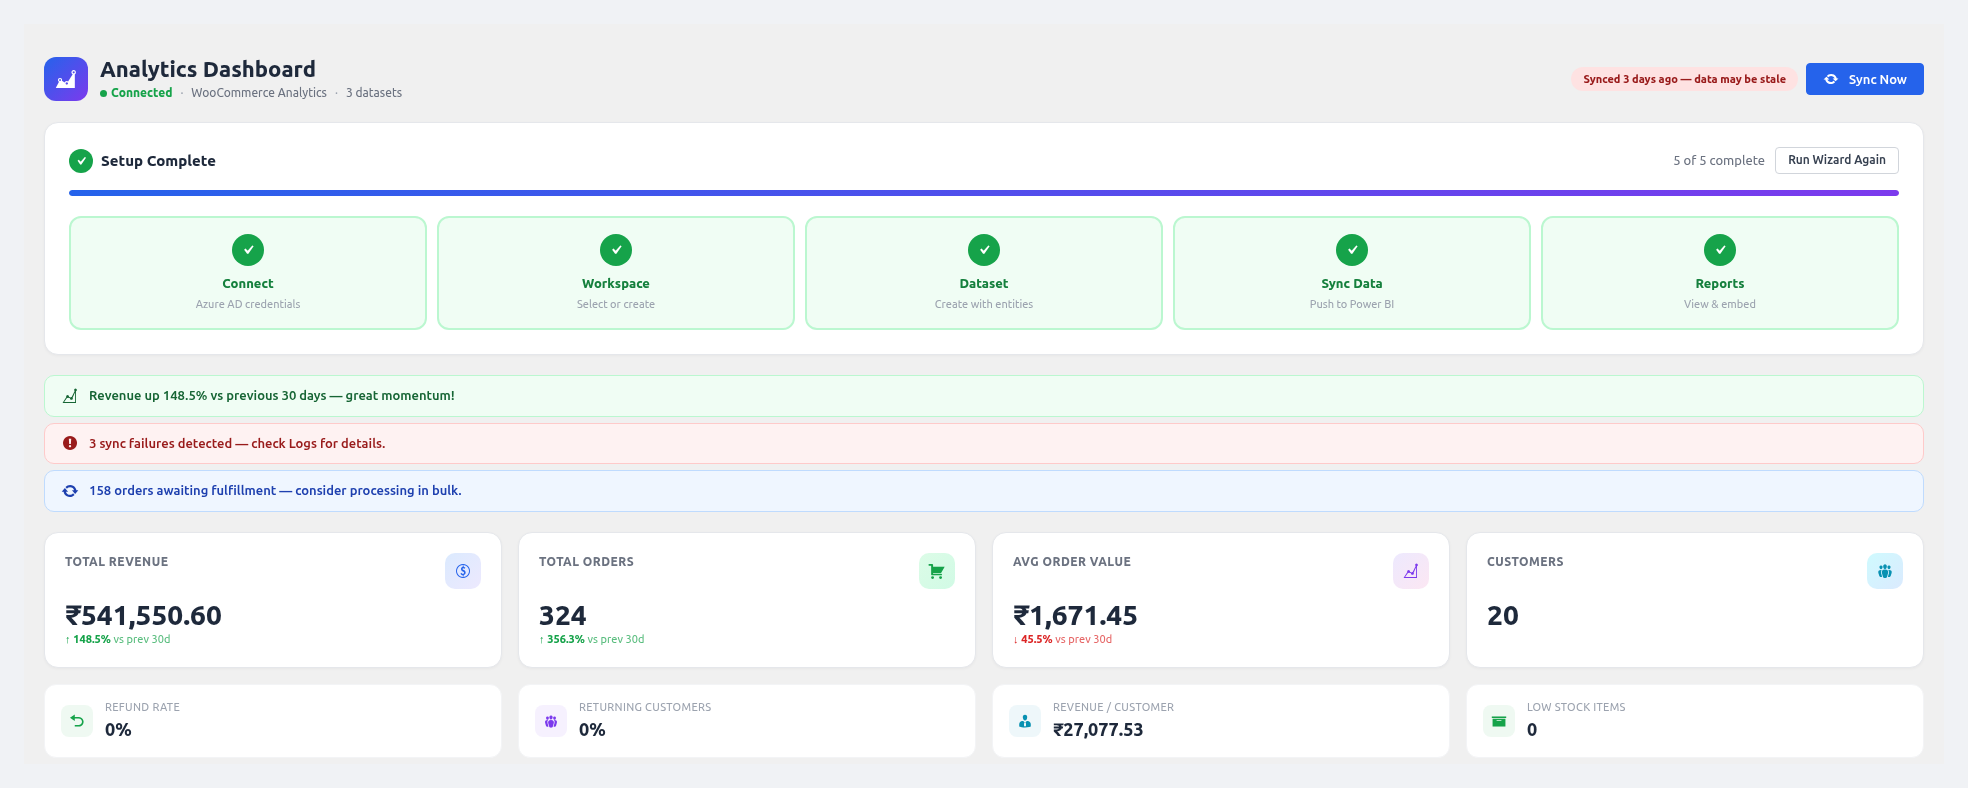 Dashboard header — connection status, setup progress tracker, smart insights, and KPI cards.
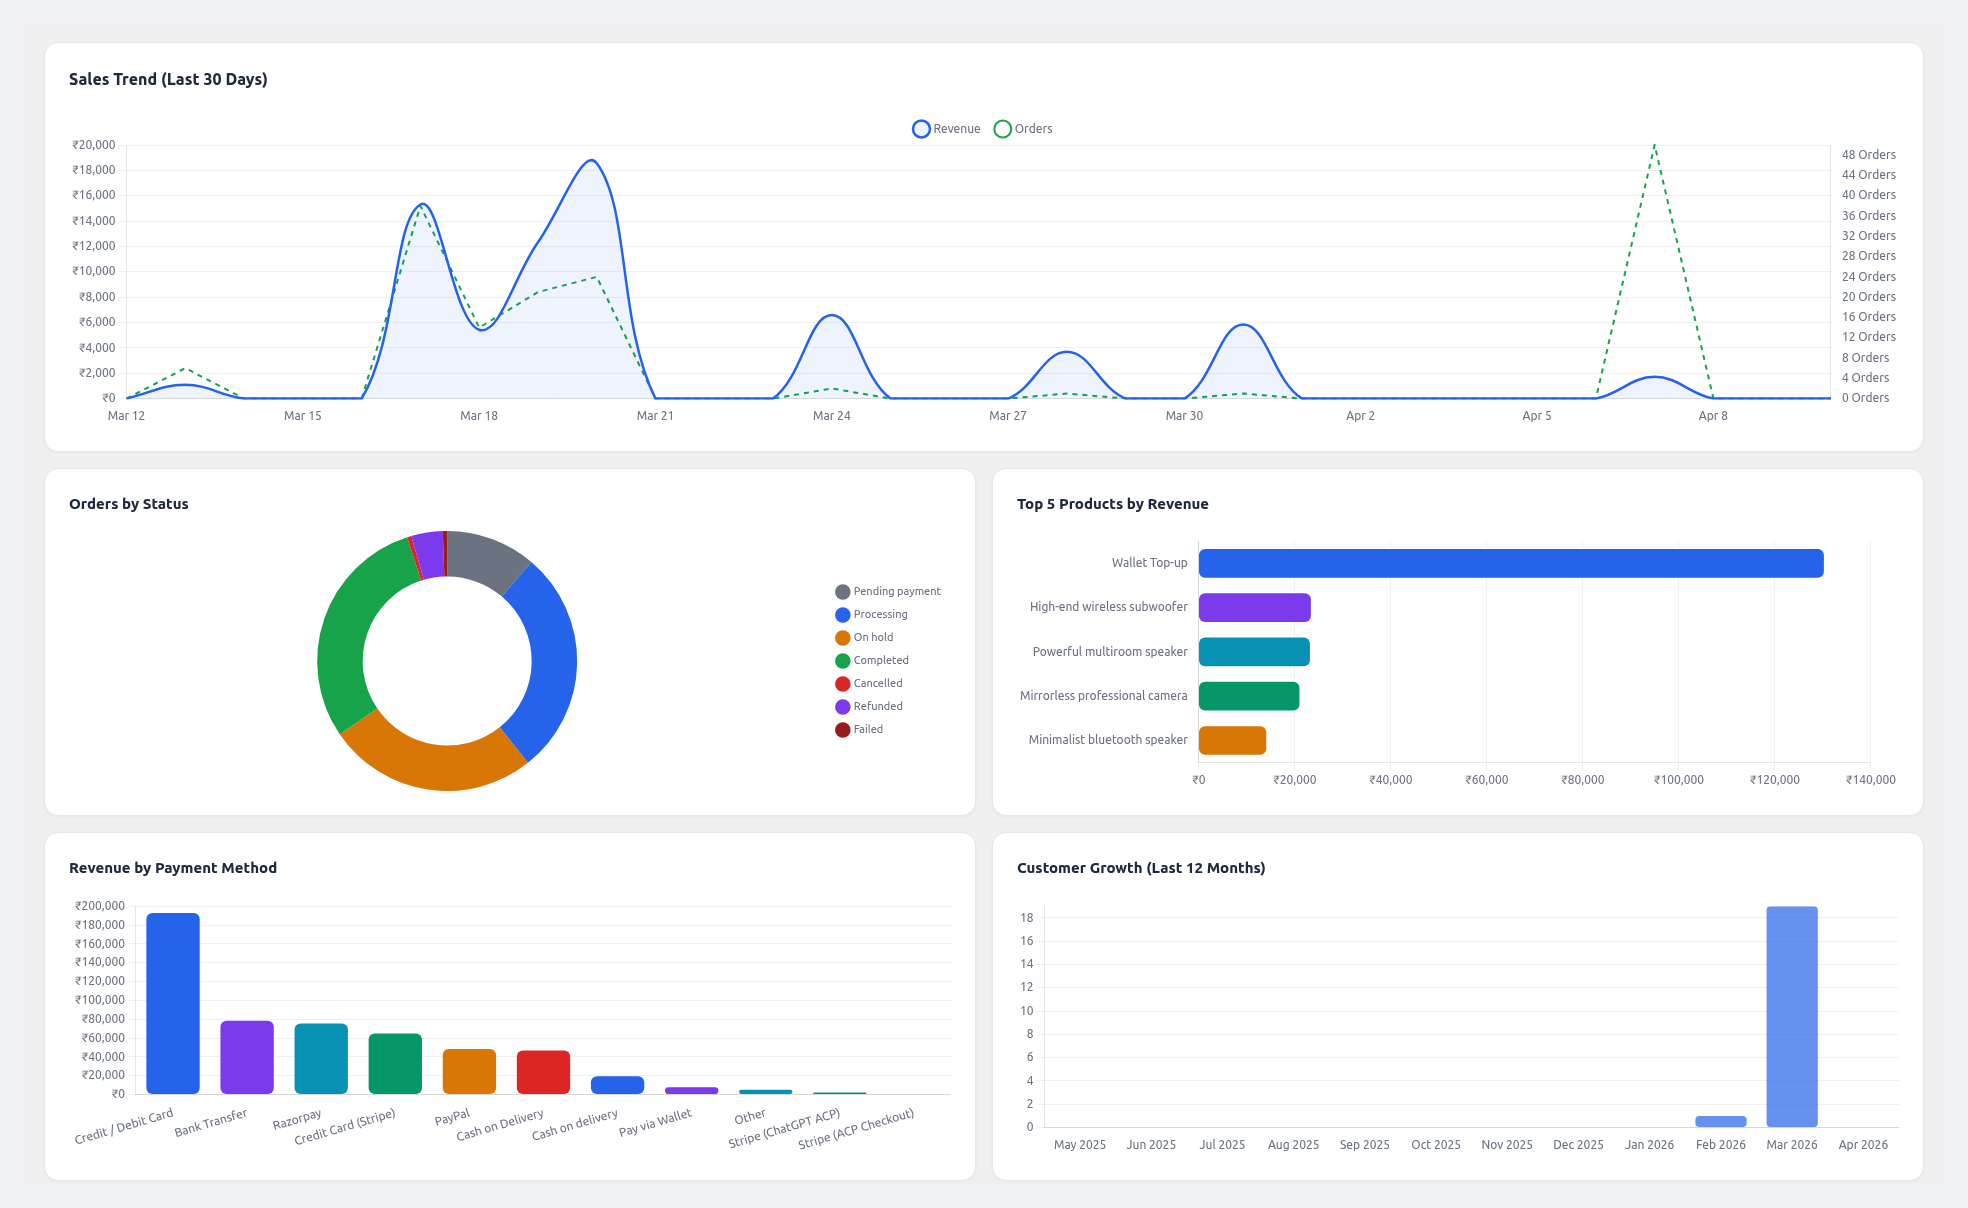 Charts — sales trend (last 30 days), orders by status pie chart, and top 5 products by revenue.
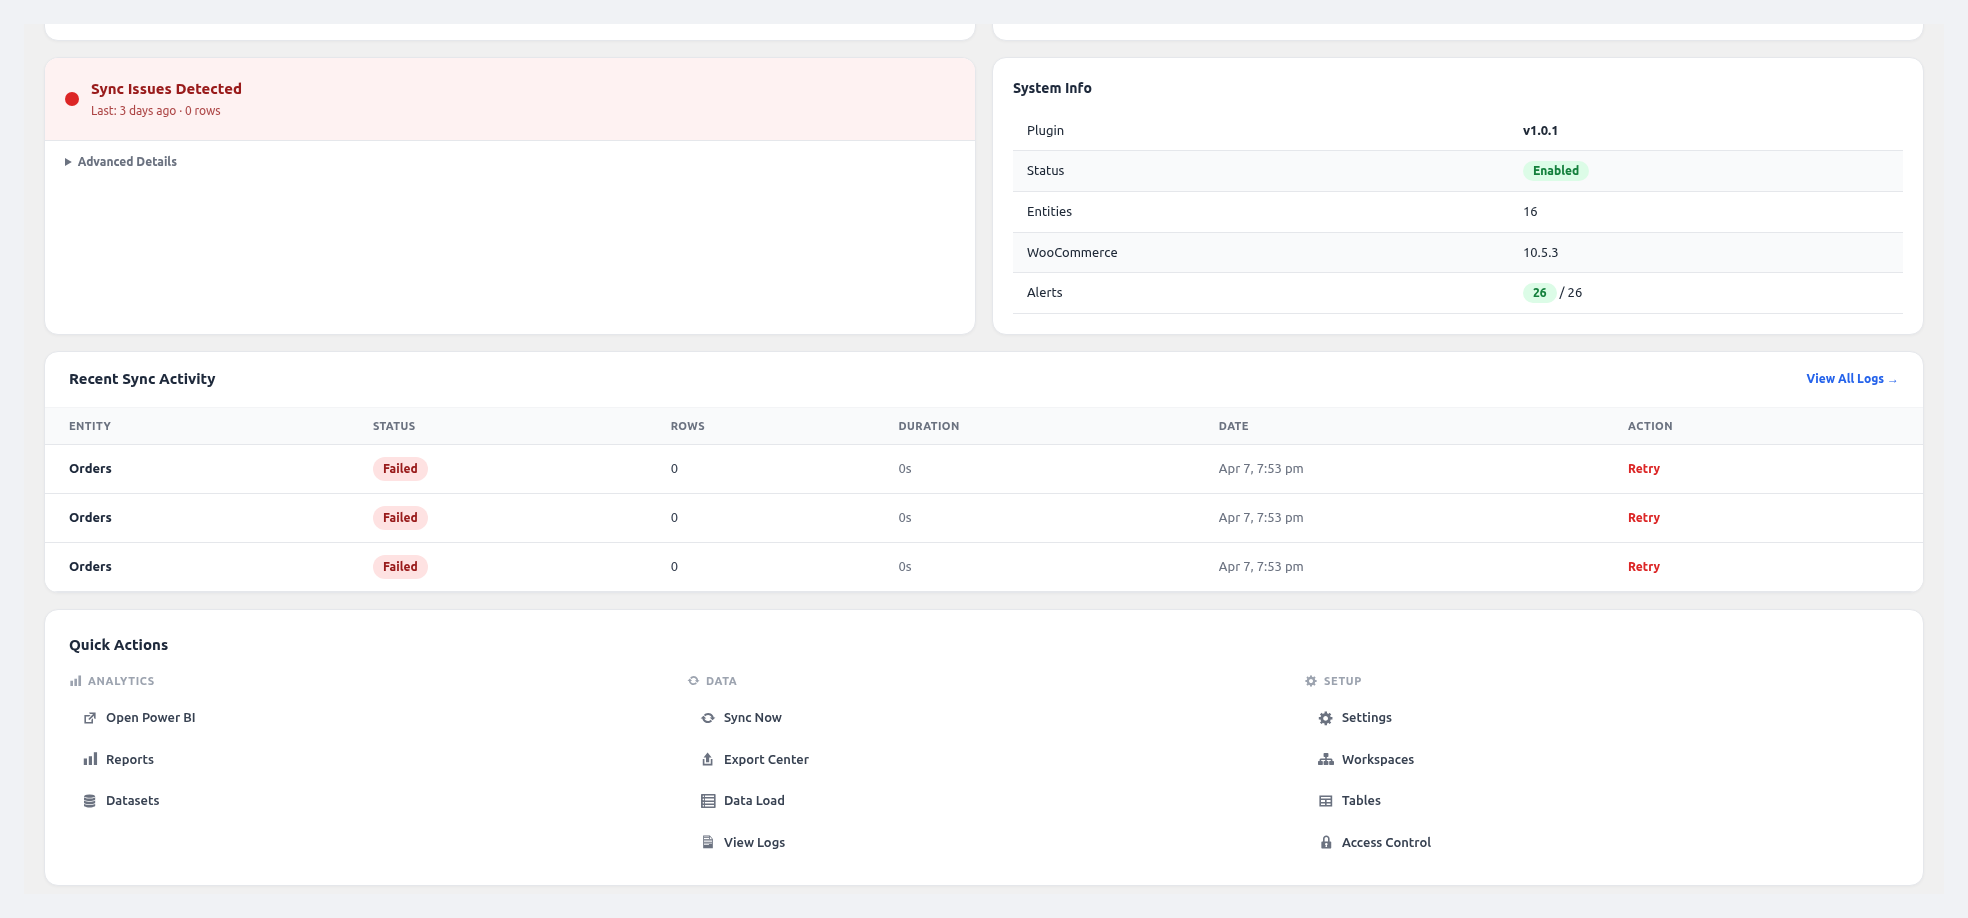 Bottom section — sync issues, system info, recent sync activity table, and quick action links.
What's on the Dashboard
Status Strip (top of the page)
| Element | Description |
|---|---|
| Connection Badge | ✅ Connected / ❌ Not Connected — based on the most recent token check. |
| Active Workspace | The Power BI workspace currently targeted. Click to change. |
| Data Freshness Badge | Green (synced < 1 hour ago), Yellow (< 24 hours), Red (> 24 hours or never). |
| Last Sync Time | Timestamp of the last successful sync. |
| Next Scheduled Sync | When the next cron run will fire. |
KPI Cards
- Total Revenue (last 30 days) with % change vs previous 30 days
- Total Orders with % change
- Average Order Value
- New Customers (last 30 days)
Each card links to a matching Power BI report for drill-down.
Charts
- Sales Trend — line chart, revenue + order count over the last 30 days
- Orders by Status — pie chart
- Top 5 Products by Revenue — horizontal bar chart
- Revenue by Payment Method — donut chart
- Customer Growth — monthly new-customer line chart
All charts are rendered with Chart.js and refresh from the locally-cached data (updated after each sync).
Smart Insights Panel
Automatically surfaces important signals, e.g.:
- 🔥 Revenue up 22% vs last week
- ⚠️ Refund rate spiked (3.2% → 5.8%)
- ❌ Last sync failed — 2 entities not updated
- 📉 Customer growth has flattened this month
Each insight has a quick action button.
Quick Actions
Grouped in three sections:
- Analytics — Open Dashboard, Open Reports, Open Query Builder
- Data — Sync Now, Open Export Center, Open Data Load
- Setup — Settings, Access Control, Setup Wizard
Setup Progress Tracker
If you haven't completed all setup steps (Azure credentials, workspace, first sync, first alert), the tracker shows what's missing and links to fix it.
Troubleshooting the Dashboard
| Problem | Fix |
|---|---|
| "Not Connected" badge even though credentials are saved | Run Test Connection in Settings → Authentication. Re-run OAuth from Setup Wizard if the token expired. |
| KPI cards all show zero | No sync has run yet, or no data matched the last 30 days. Trigger a manual sync from the Sync page. |
| Charts not rendering | Clear your browser cache. Disable conflicting JS plugins. Check the browser console for errors. |
| "Data Freshness: Red" | Scheduled sync is not running. Verify cron is working: `wp cron event list |