Analytics Dashboard
KPIs and trend charts driven by the wallet's audit log. Auto-refreshing, cached, and exportable.
What It Does
| For | Means |
|---|---|
| Admin | One screen to see "How much credit issued? How many active wallets? Pending withdrawals? Top spenders?" |
| Operations | Spot trends — cashback effectiveness, referral conversion, BNPL exposure |
Where It Lives
Wallet → Analytics in the admin sidebar.
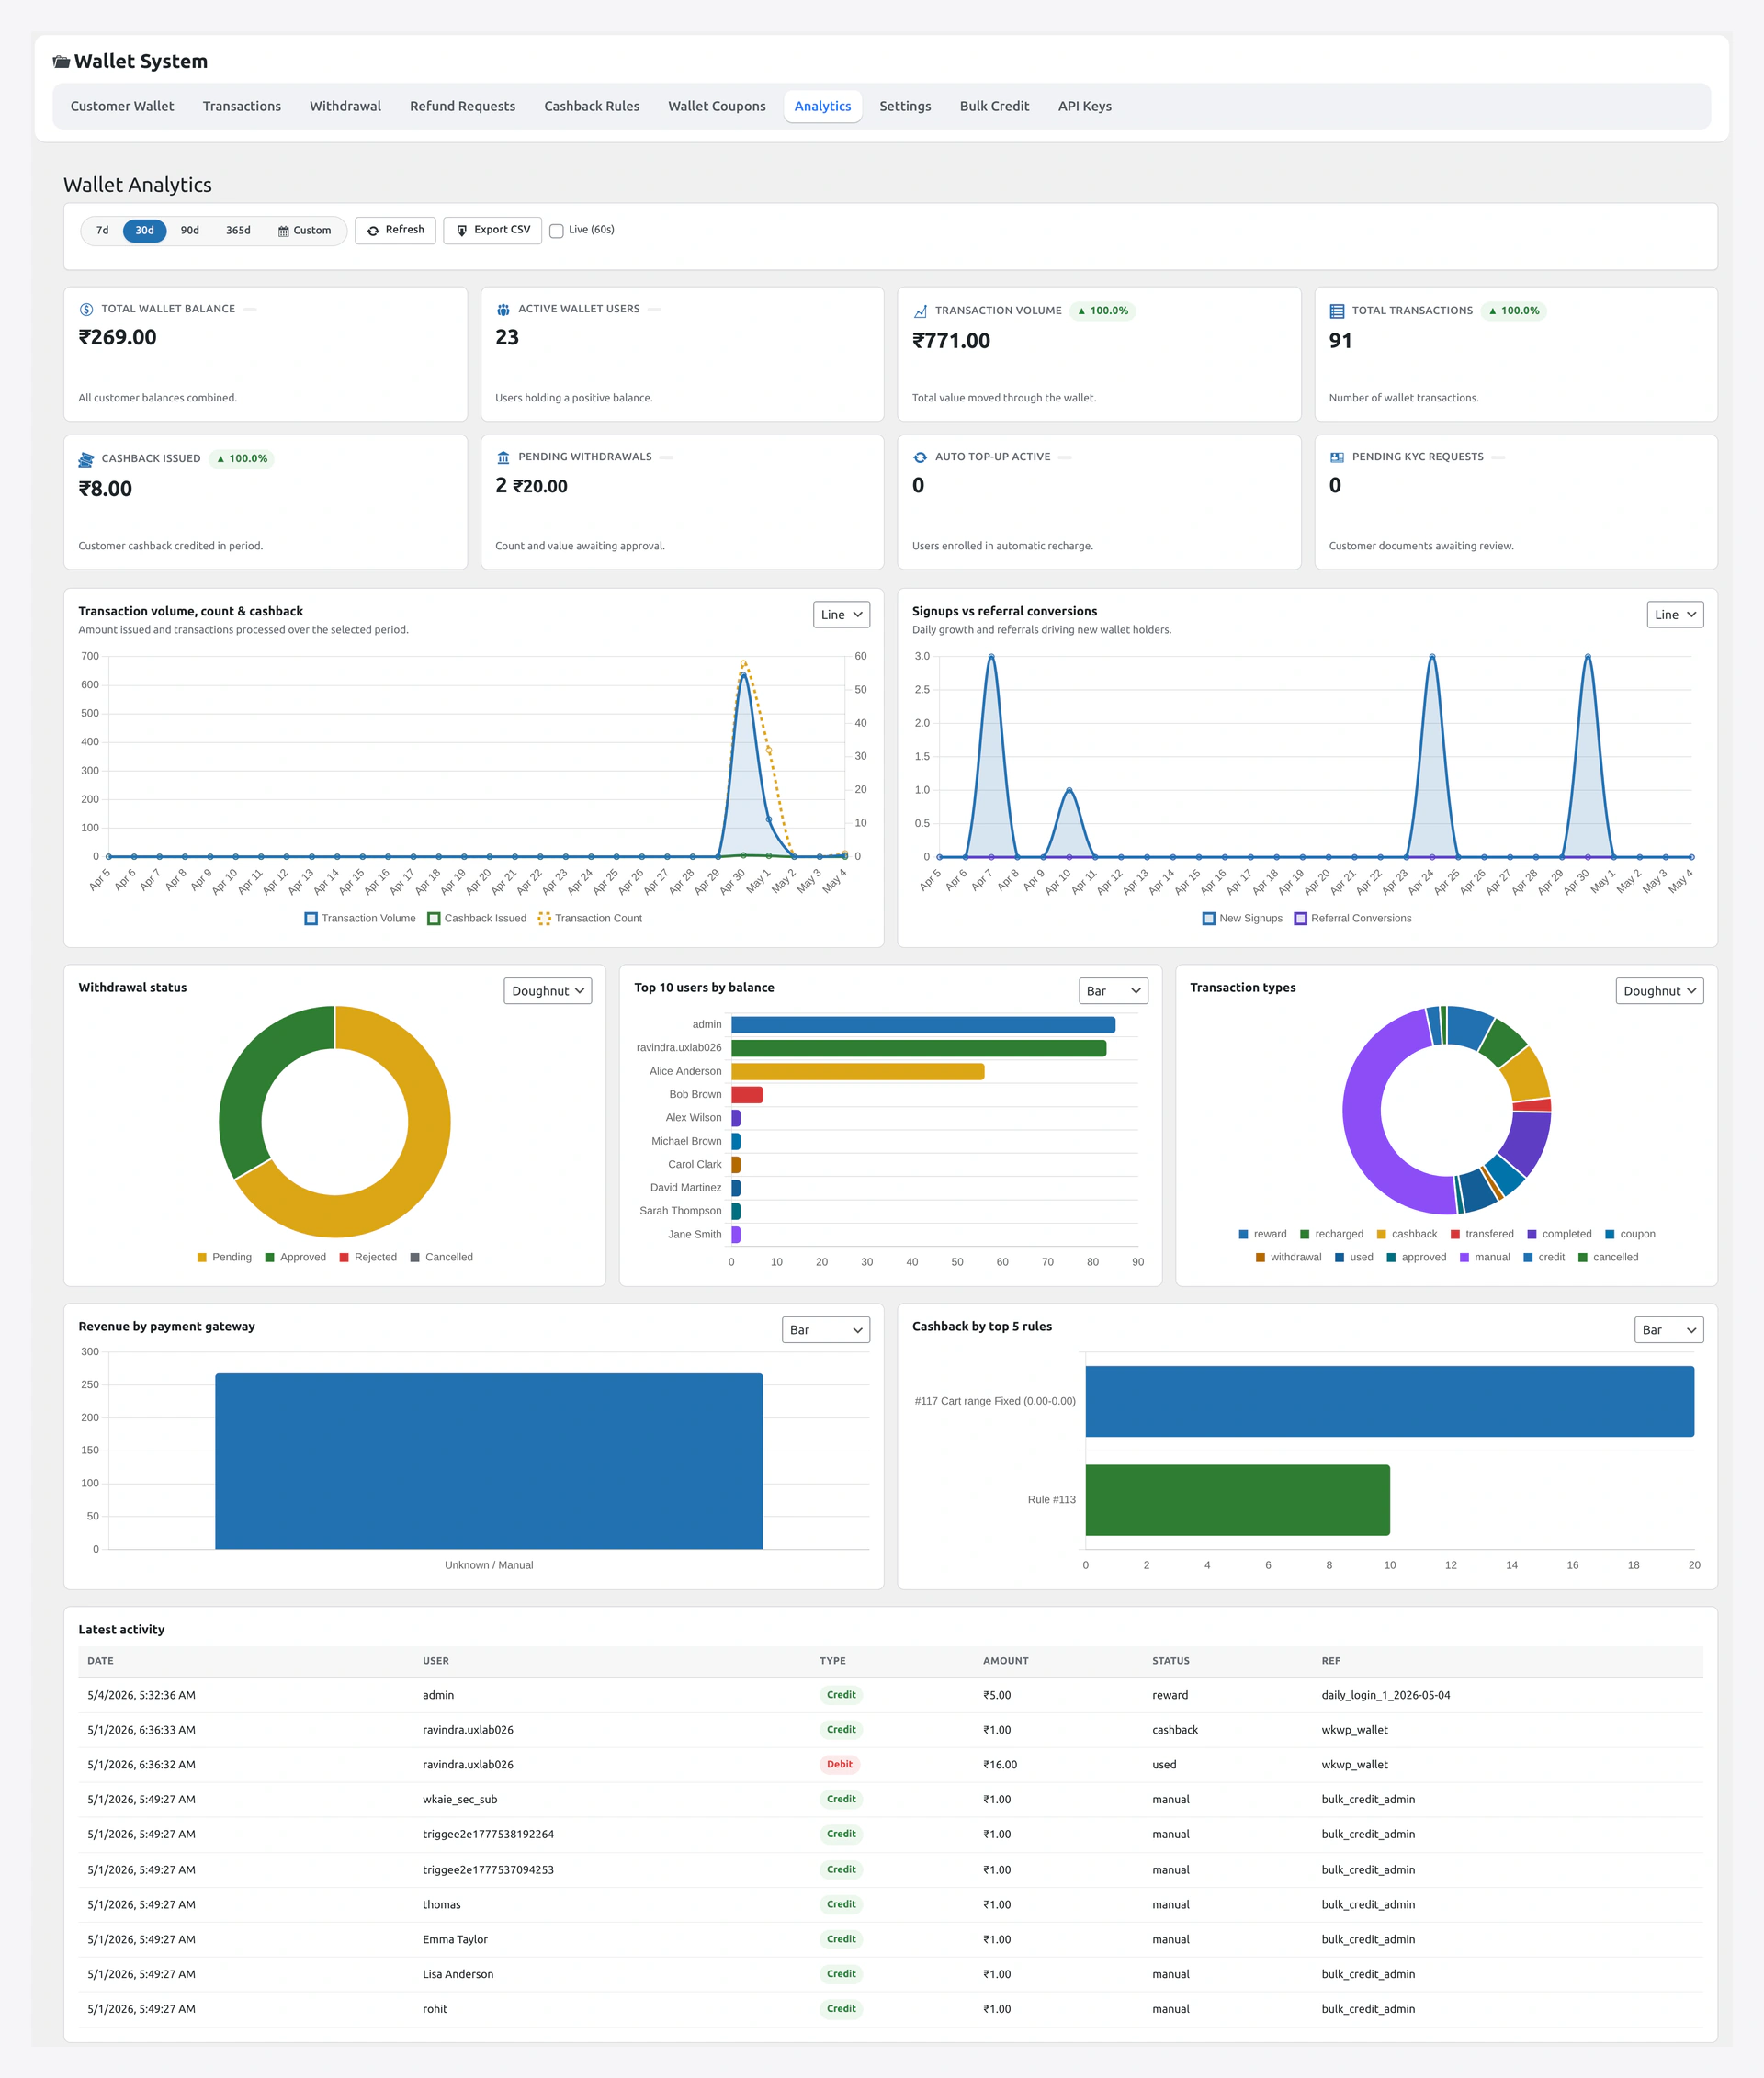
KPIs (top of the page)
| Card | What it shows |
|---|---|
| Total credited (window) | All money flowing into wallets |
| Total debited (window) | All money flowing out |
| Active wallets | Distinct customers with non-zero balance |
| Transactions (window) | Total ledger rows |
| Pending withdrawals | Awaiting admin approval |
| Pending KYC | Awaiting admin review |
| Pending refund requests | Awaiting admin decision |
| Outstanding BNPL | Total debt across all customers |
Each KPI is clickable → jumps to the matching list page.
Charts
| Chart | What it shows |
|---|---|
| Transaction volume | Daily count over the window |
| Net wallet movement | Net flow (credits minus debits) per day |
| Credited vs debited | Stacked daily bars |
| Top spenders | Customer leaderboard by debit volume |
| Top referrers | Customer leaderboard by referral payout |
| Cashback issued | Daily cashback total |
| Withdrawal volume | Daily payout total |
Window selector: 7 days / 30 days / 90 days / 365 days / custom.
Cashback Effectiveness Panel
Auto-computed:
- Total cashback issued (window)
- Cashback issued / orders completed ratio
- Cashback redemption rate (cashback used in subsequent orders / cashback issued)
- Top cashback rule (% of total cashback by rule)
Useful to tune your rule amounts.
Referral Effectiveness Panel
Auto-computed:
- Total referral payouts (window)
- Total invitee signups (link-driven)
- Total invitee first-completed orders → conversion rate
- Top referrers (count + amount)
- Multilevel chain depth distribution
CSV Export
Click Download CSV on any chart card → exports the visible series for that window. Use for accounting / external reporting.
Caching
Both KPI summary and chart payloads are cached so the dashboard stays fast even on stores with millions of wallet rows. Caches auto-invalidate when relevant events fire (wallet credit, withdrawal approval, KYC decision).
Common Scenarios
"Did my Q4 cashback campaign work?"
Set window to the campaign dates. Open Cashback Effectiveness panel. Compare redemption rate to the previous quarter.
"Who's my top wallet customer?"
Top spenders panel. Click any row → drills into that customer's wallet card.
"How much am I exposed to BNPL?"
Outstanding BNPL KPI card. Click → list of customers with debt rows.
"Push the data into our reporting tool"
Use the REST endpoints (see dev section) to pull the same data into your BI / spreadsheet workflow.
When Something Goes Wrong
| Problem | Fix |
|---|---|
| KPIs stuck on stale numbers | Cache not bust — clear via Status Tools or wait 1h |
| Chart blank | Try a different metric or window |
| Slow dashboard on large stores | Daily rollup not running — check cron events |
| CSV download timeouts | Reduce window size; raise the export row cap if needed |
For developers — REST endpoints + custom metrics
REST endpoints
| Endpoint | Method | Purpose |
|---|---|---|
/wp-json/wkwp-wallet/v1/analytics/summary | GET | KPI card payload |
/wp-json/wkwp-wallet/v1/analytics/chart?days=30&metric=count | GET | chart series for the requested metric |
Auth: admin (Basic Auth via API key, or capability check).
Summary response
{
  "currency": "USD",
  "window_days": 30,
  "credited_total": 450000.00,
  "debited_total": 312500.00,
  "transaction_count": 4231,
  "active_wallets": 892,
  "pending_withdrawals_count": 7,
  "pending_kyc_count": 12,
  "pending_refund_requests_count": 3,
  "outstanding_bnpl": 18750.00,
  "generated_at": "2026-04-29T07:14:23Z",
  "cache_until": "2026-04-29T08:14:23Z"
}
Chart response
{
  "metric": "count",
  "window_days": 30,
  "series": [
    { "date": "2026-04-01", "value": 142 },
    { "date": "2026-04-02", "value": 187 }
  ]
}
Hooks
| Hook | Type | When |
|---|---|---|
wkwp_analytics_summary_payload | filter | mutate response payload |
wkwp_analytics_chart_metrics | filter | register a custom metric |
wkwp_analytics_cache_ttl | filter | mutate cache TTL globally or per-metric |
wkwp_analytics_summary_generated | action | after KPI compute |
Custom metric
add_filter( 'wkwp_analytics_chart_metrics', function( $metrics ) {
    $metrics['avg_topup_amount'] = function( $window_days ) {
        global $wpdb;
        return $wpdb->get_results( $wpdb->prepare(
            "SELECT DATE(created_at) AS date, AVG(amount) AS value
             FROM {$wpdb->prefix}wkwc_wallet_transactions
             WHERE type = 'credit' AND reference LIKE 'order:%:topup'
               AND created_at >= NOW() - INTERVAL %d DAY
             GROUP BY DATE(created_at)",
            $window_days
        ), ARRAY_A );
    };
    return $metrics;
} );
Chart endpoint will accept ?metric=avg_topup_amount.
Performance
Stores with > 1M ledger rows benefit from a daily rollup table — pre-computed daily aggregates serve windows > 30d in milliseconds. Background indexer maintains it on cron.